What the Foreclosure Headlines Aren’t Telling You
General
General
You've probably seen the headlines saying, "foreclosures are on the rise,” and maybe your mind jumped straight to 2008. That’s understandable. A lot of people remember that crash and all the foreclosures that happened during that window, and they’re hoping something like that never happens again.
But this isn’t a repeat of what happened back then. Here’s the context to prove it.
Yes, foreclosure filings are up 26% from a year ago, according to ATTOM. And they’ve been rising for 5 straight quarters. That's a real trend worth paying attention to. But the full picture isn’t scary like the headlines suggest.
The reality is the increase we’re seeing is a sign of the market normalizing.
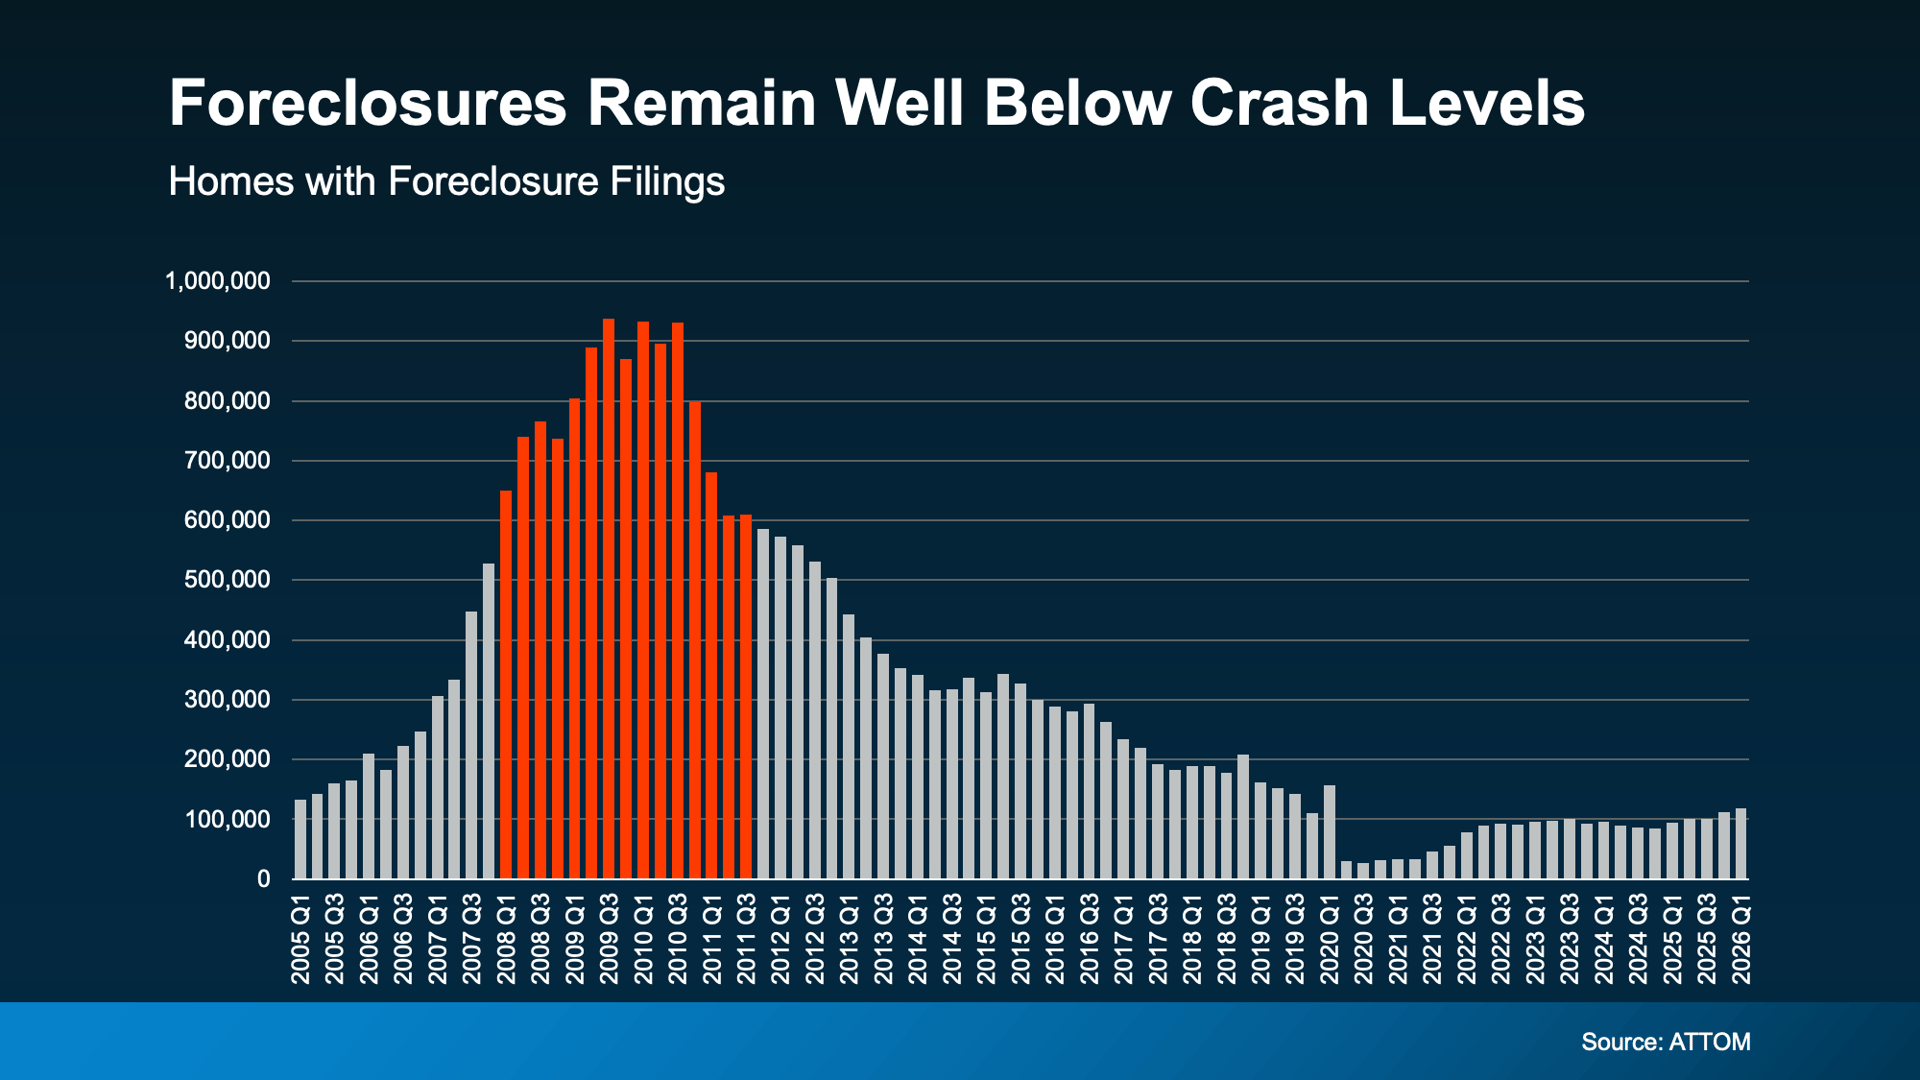
Here's an important thing to know about this chart. The extremely low numbers you see in 2020 and 2021 don't represent what's "normal." That's when the government put a moratorium on foreclosures to help homeowners get through the pandemic. Those years were an exception, not the baseline.
Instead, compare where we are today to 2017, 2018, and 2019 – the last years the market was running normally. Today's numbers are still lower. So, we're not even back to what's typical, yet. That means this can’t be a crash. (see graph below):
While today's numbers are getting closer to pre-pandemic levels, they're still below historical norms. And just look at what was happening around 2008. Even with the recent increase, we're nowhere near those levels. This is a market returning to normal, not heading toward a crisis.
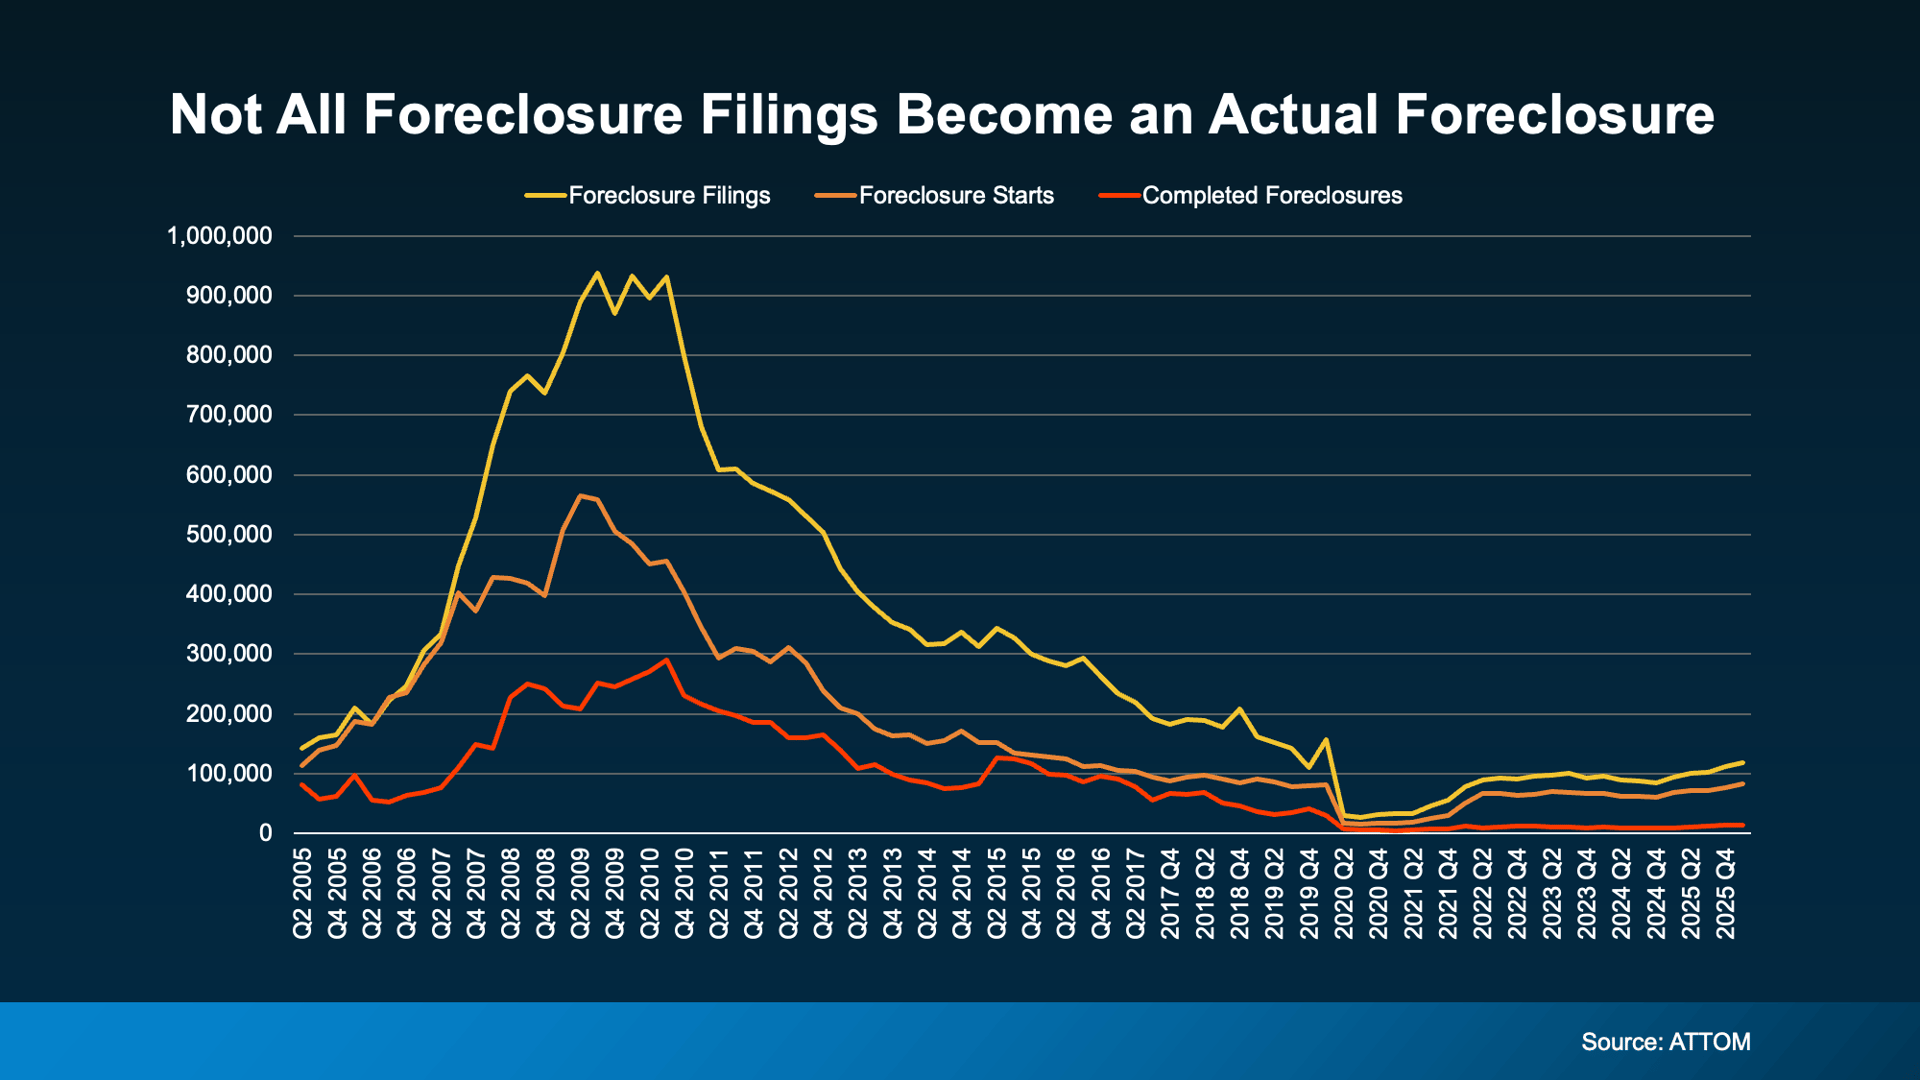
Most of those filings won't even end in a completed foreclosure. That's because today's homeowners have something most people in 2008 simply didn't have. And that’s equity.
The average homeowner today is sitting on roughly $295,000 in home equity right now, according to Cotality. Back in 2008, many people owed more than their homes were worth. Selling wasn't an option. And foreclosure was often the only door available.
Today, that's not the case. If you have enough equity to cover what you owe and the cost of selling, you could sell your home, pay off your debt, protect your credit, and potentially walk away with money in your pocket.
That's a completely different situation than what homeowners faced during the last crash, and it's a big reason we're unlikely to see foreclosures spiral the way they did back then.
Check out the graph below. It shows foreclosure data from ATTOM going back to 2005. Here's how to read it:
Maybe you're behind on payments. Maybe you're stressed about what comes next. That's an incredibly hard place to be, but it's important to know that missing a payment or two doesn't automatically mean you'll lose your home.

Buyer

Buyer

General

General
General

General

General

Buyer

Buyer